Hyper-Buildings Have become a symbol of Dark and Dystopian living, where residences are in low living standards & disconnected from the world. Residential living in a hyper-building must balance high-density living with comfort, health, and amenities that can support and sustain inhabitants. The Residential Team aims to put the residence health and comfort at the center of every decision taken using data driven design alongside Hyper-b team to ensure the ecosystem within the hyper-building is met with satisfaction rather than desolation.
PROGRAM ALLOCATION
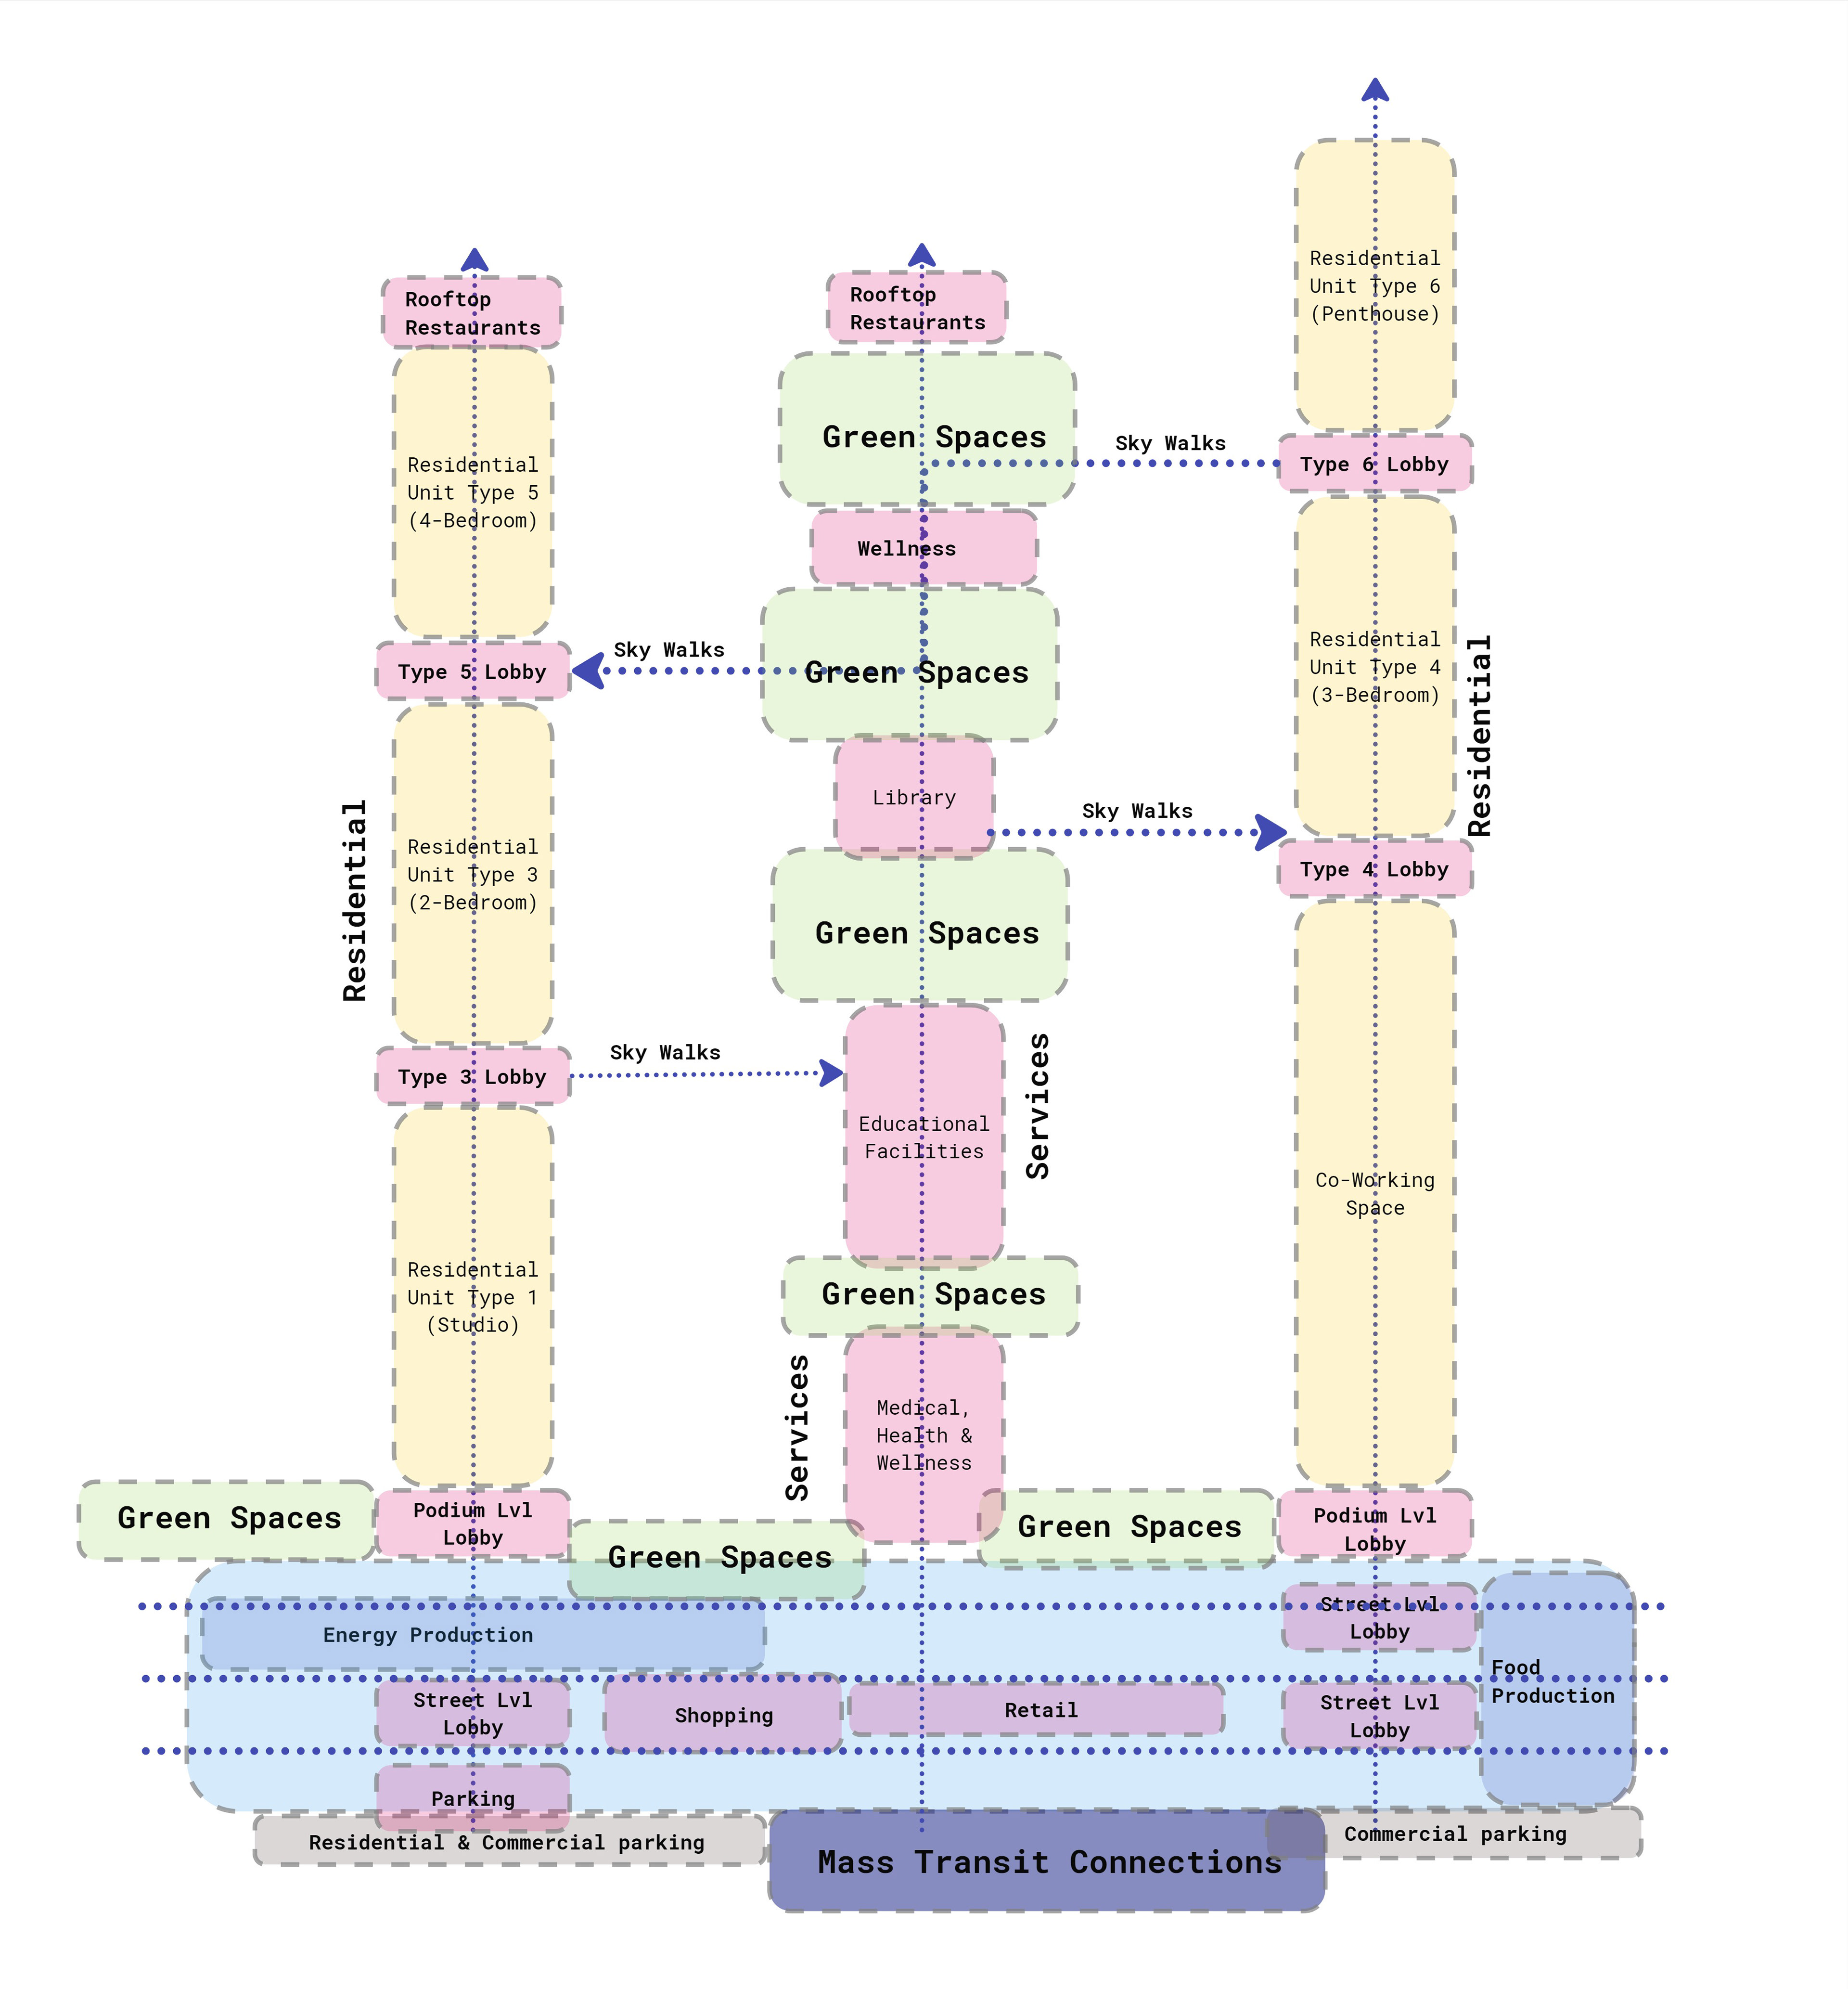

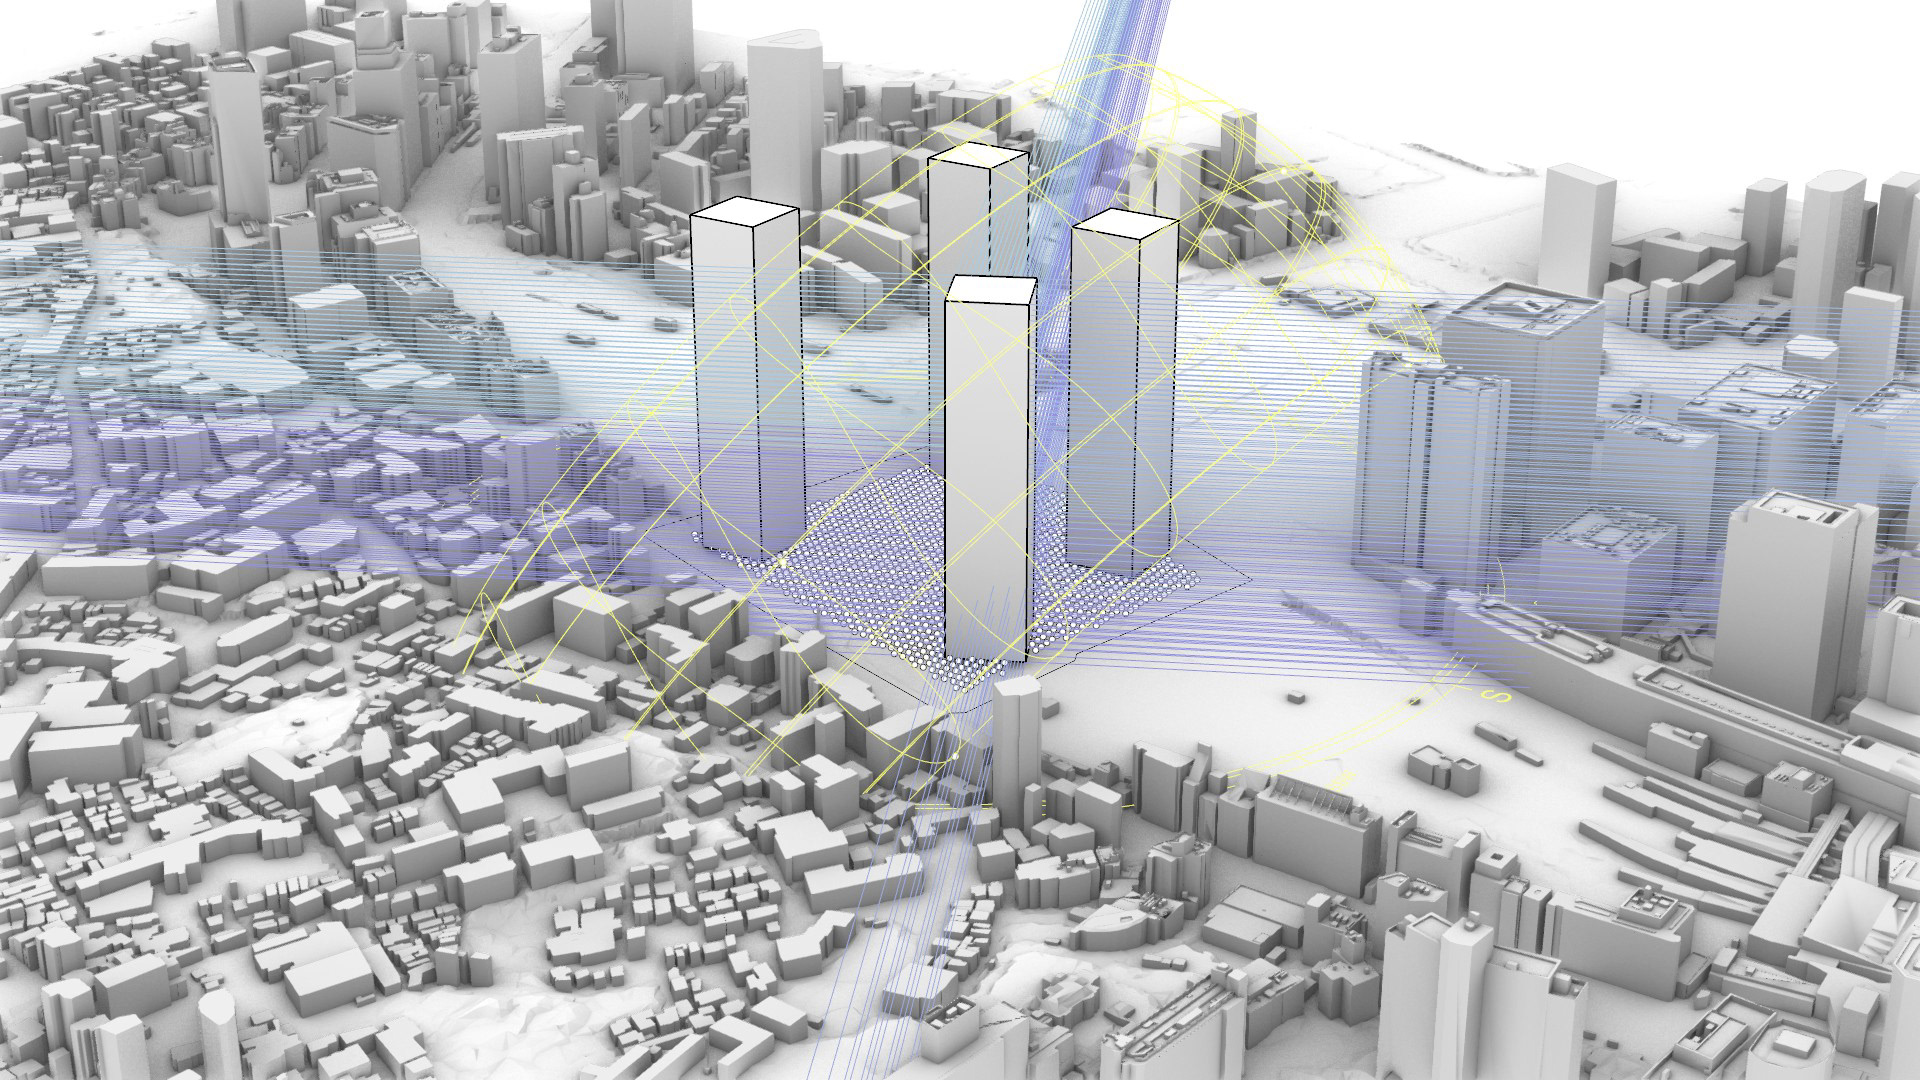
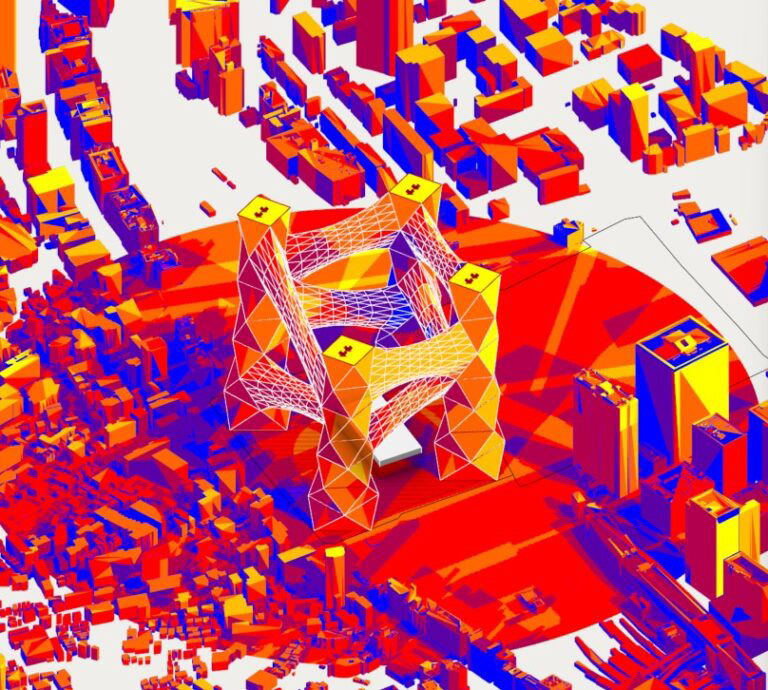
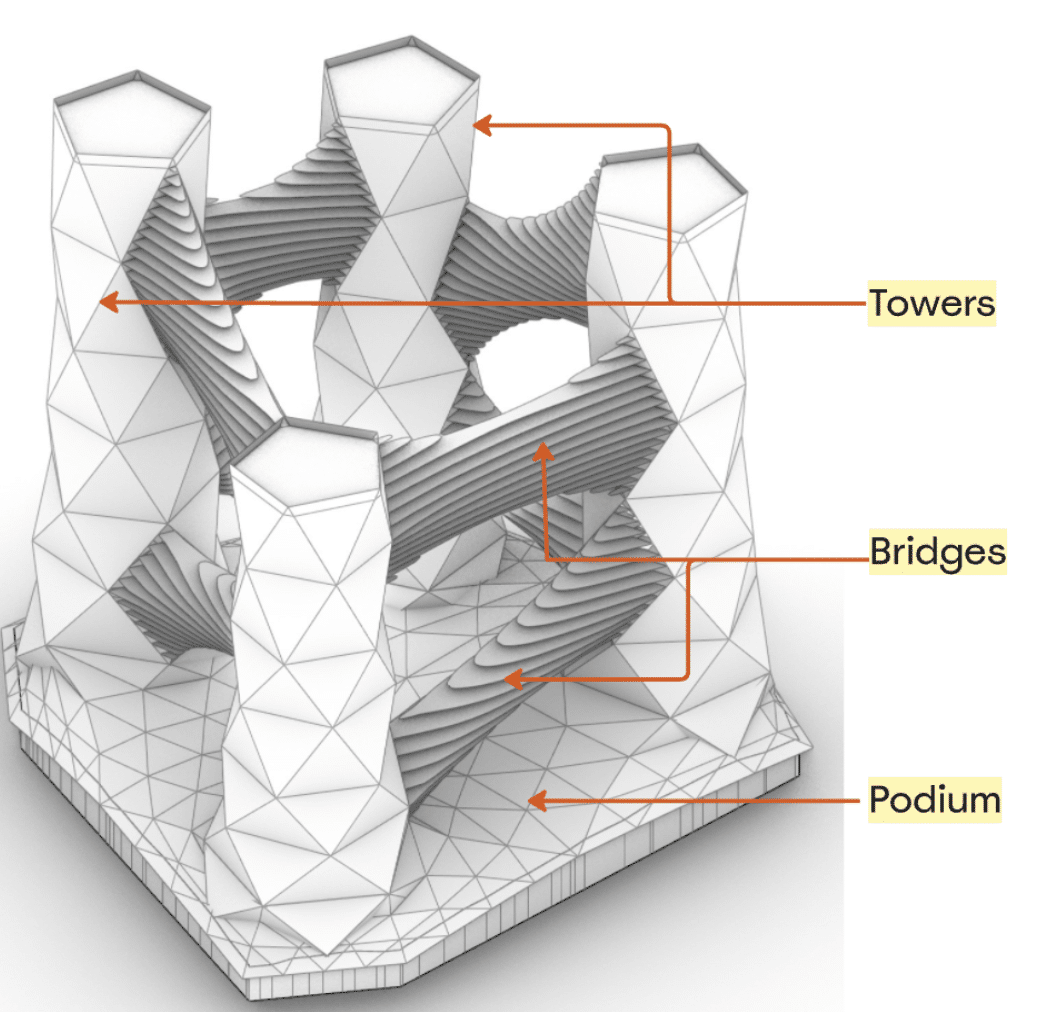
A global optimization process is implemented to systematically assessing and strategically positioning tower masses within the site’s boundaries. This approach ensures an optimal balance between natural sunlight and unobstructed sightlines. With it comes a process involving close collaboration with the Data team to integrate a comprehensive data-driven analysis. This collaboration facilitates the development of a globally revised sum of multiple programs within the tower and Bridges connections floorplates. With urban context responsiveness, we leveraged computational analysis and multi-criteria evaluation, the project refines massing decisions to achieve a well-balanced and performance-driven architectural outcome.
Data Generation – Sun Hour Daylight Simulation
Providing Natural Daylight Deep into the Floor Plate
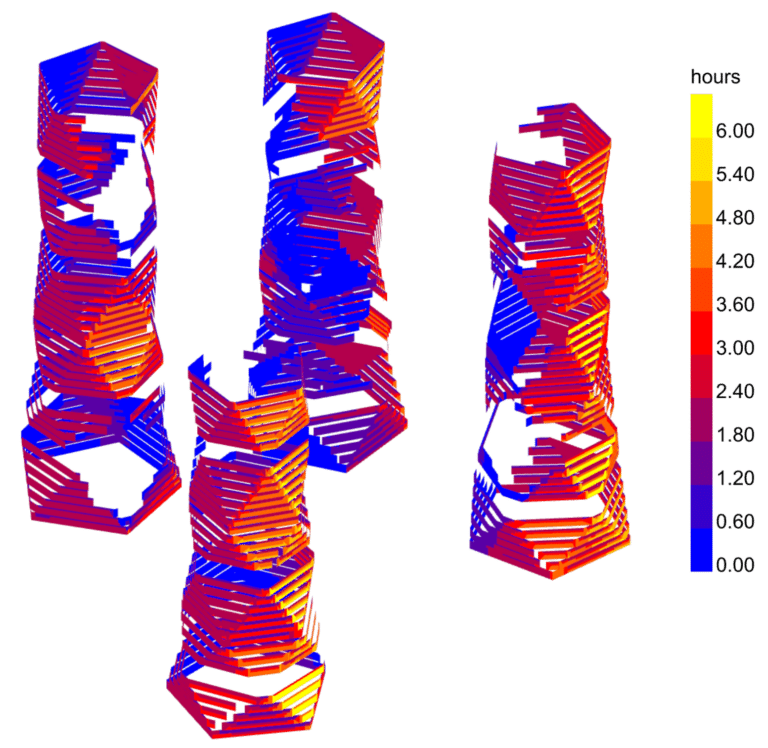
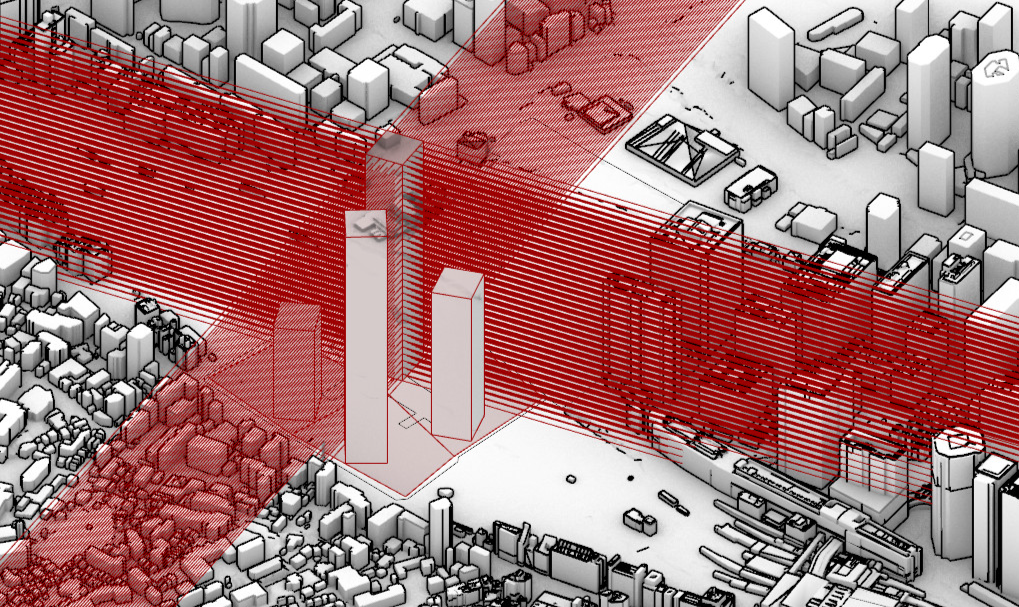
Aiming to provide sustainable solutions to the residences for healthier and nature connected living, the global optimization seeks to position towers within the site to allow sunlight to go deep into the floor plates and units achieving a Daylight Autonomy of more than 50% of the time Not only improving indoor environmental quality but also reduces the reliance on artificial lighting, leading to significant energy savings and improved occupant well-being. Spatial Daylight Autonomy (sDA): Ensure a high percentage of spaces meet daylighting thresholds to reduce reliance on artificial lighting. sDA300/50% (LEED) ≥ 55% of total floor area / Achieving this ensures at least 55% of floor area gets adequate daylight for 50% of occupied hours.
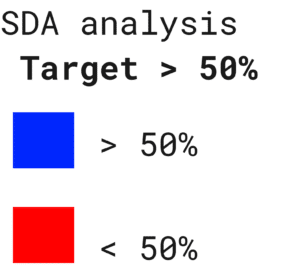
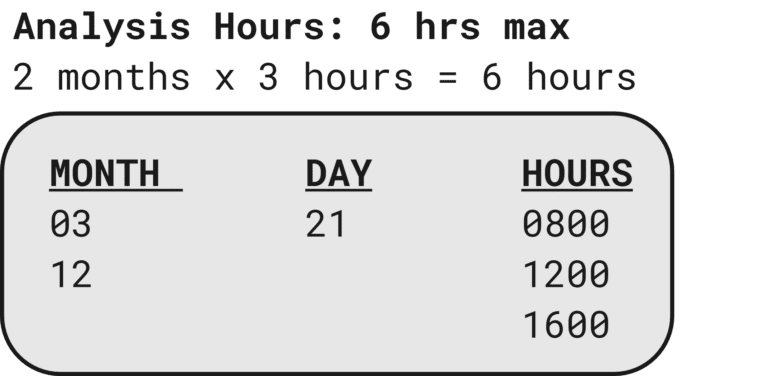
In addition to the daylight simulation we can also calculate for each unit the Sunlight daylight hours. This allows us to understand how much direct sun can be expected at certain times of the year at each unit’s facade. The benefits of this promotes natural daylight use and in winter months allows for passive heating inside units.
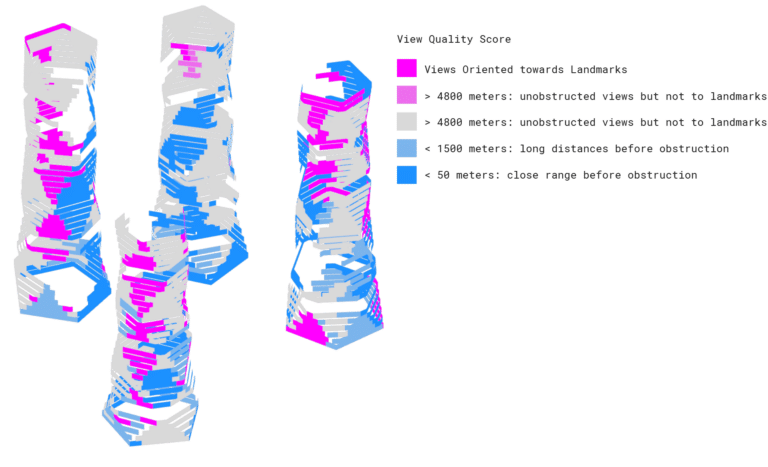
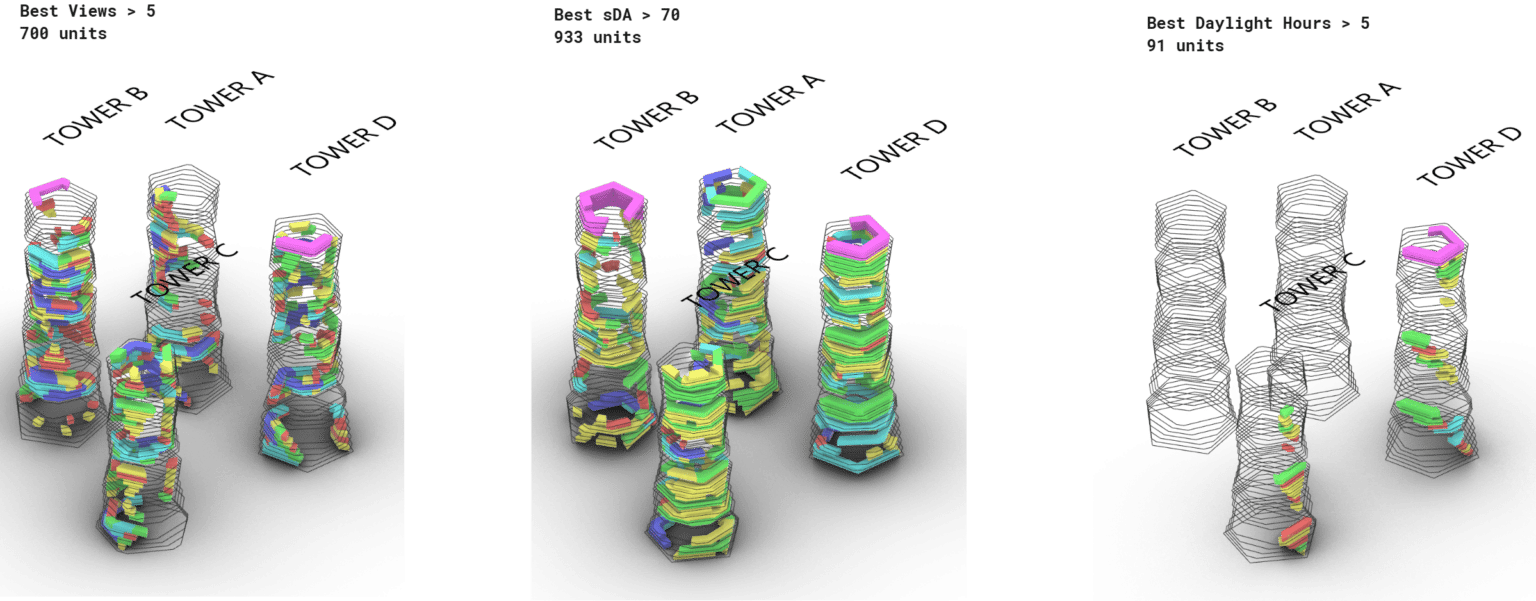
Data Generation – View Optimization
Orientation Toward Preferred Views
By experimenting with different building configurations and orientation, our goal is to achieve an optimal tower position with unobstructed views and extended sightlines as far as possible. his process not only enhances visual connectivity with the surrounding environment but also contributes to the overall aesthetic and experiential quality of the development. Additionally, we are specifically targeting key natural and urban landmarks to establish a strong connection between the towers and Tokyo’s most iconic sights like Tokyo Bay (SE 123°) | Mountain Fuji (SW 243°) | Tokyo Tower (NW 350°) | Tokyo Sky tree (N 40°)
By manipulating a View Gard at these locations, we are rewarding orientations that look toward the landmarks, thus an optimizer understands orienting toward them will yield higher results leading toward views that look toward them.
By manipulating a View Gard at these locations, we are rewarding orientations that look toward the landmarks, thus an optimizer understands orienting toward them will yield higher results leading toward views that look toward them.
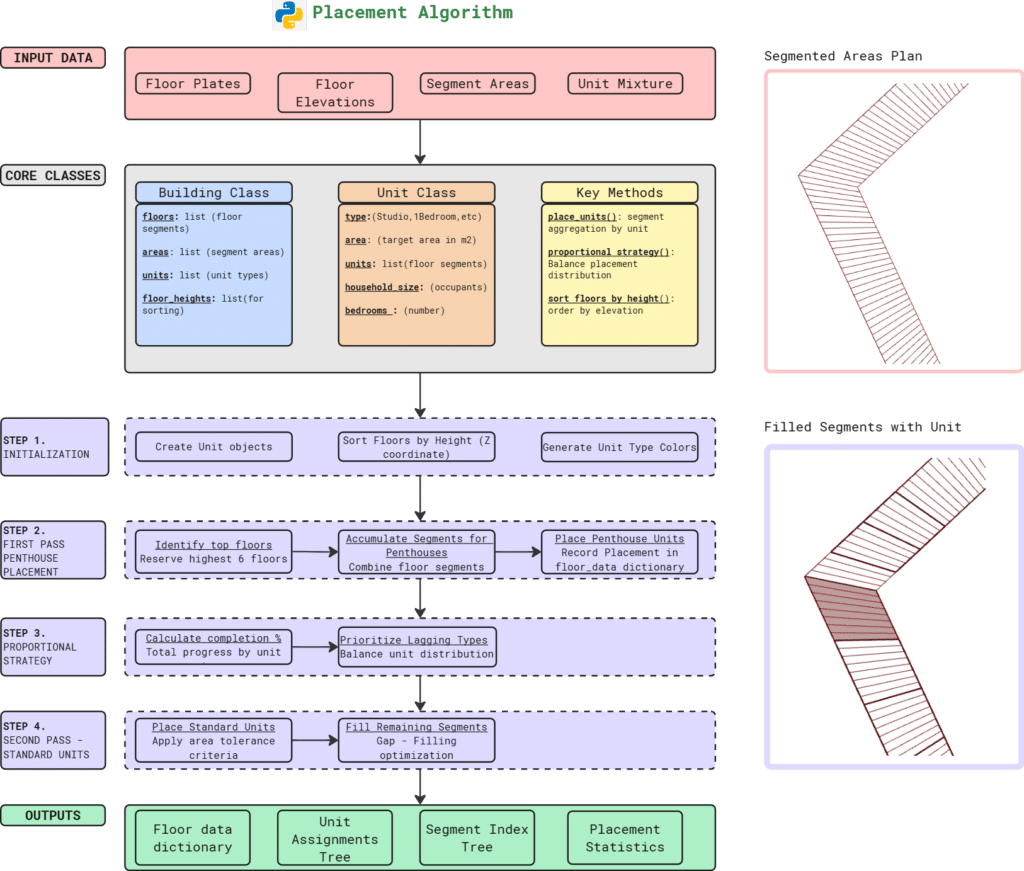
Placement Algorithm
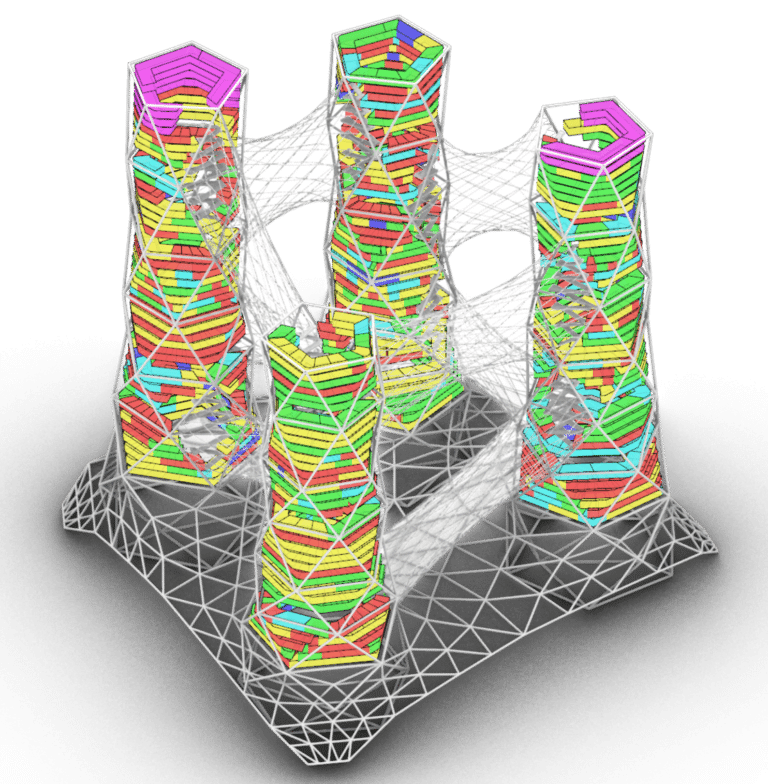
An algorithm was developed using python that will attempt to maximize the placement of units to achieve their target counts while following a set of constraints and priorities. It is inspired by the Knapsack algorithm, that attempts to fill a Knapsack with elements of unique sizes until it is full. So in the case of the unit placement, the algorithm knows the area of the floor plate which is analogous to the knapsack and the area of the unit with is the unique element. The iterative process steps through each floor placing the unique elements until the floorplate area is filled or there is no longer space adequate for any unit. This allows automation of variety per floor yet following the unique constraints guided by the overall concept and priorities of the projects goal.
Data Curation – Best Apartments by Type \ Metrics
Metrics-Based Analysis and Identification of Optimal Apartment Units
The Data Curation process plays a crucial role in evaluating the performance of the building at a unit-by-unit level. By leveraging computational analysis and structured data organization, we can systematically assess each unit’s overall metric performance. This approach allows us to curate and categorize apartments based on (KPIs), helping to identify and highlight the best units according to specific criteria.
By integrating data-driven insights into the design process, we can prioritize and refine unit configurations to optimize comfort, sustainability, and desirability. This methodology not only enhances the overall residential experience but also ensures that each apartment is tailored to meet specific user needs and environmental goals.

Parametric and Environmental Data Integration in BIM Workflows
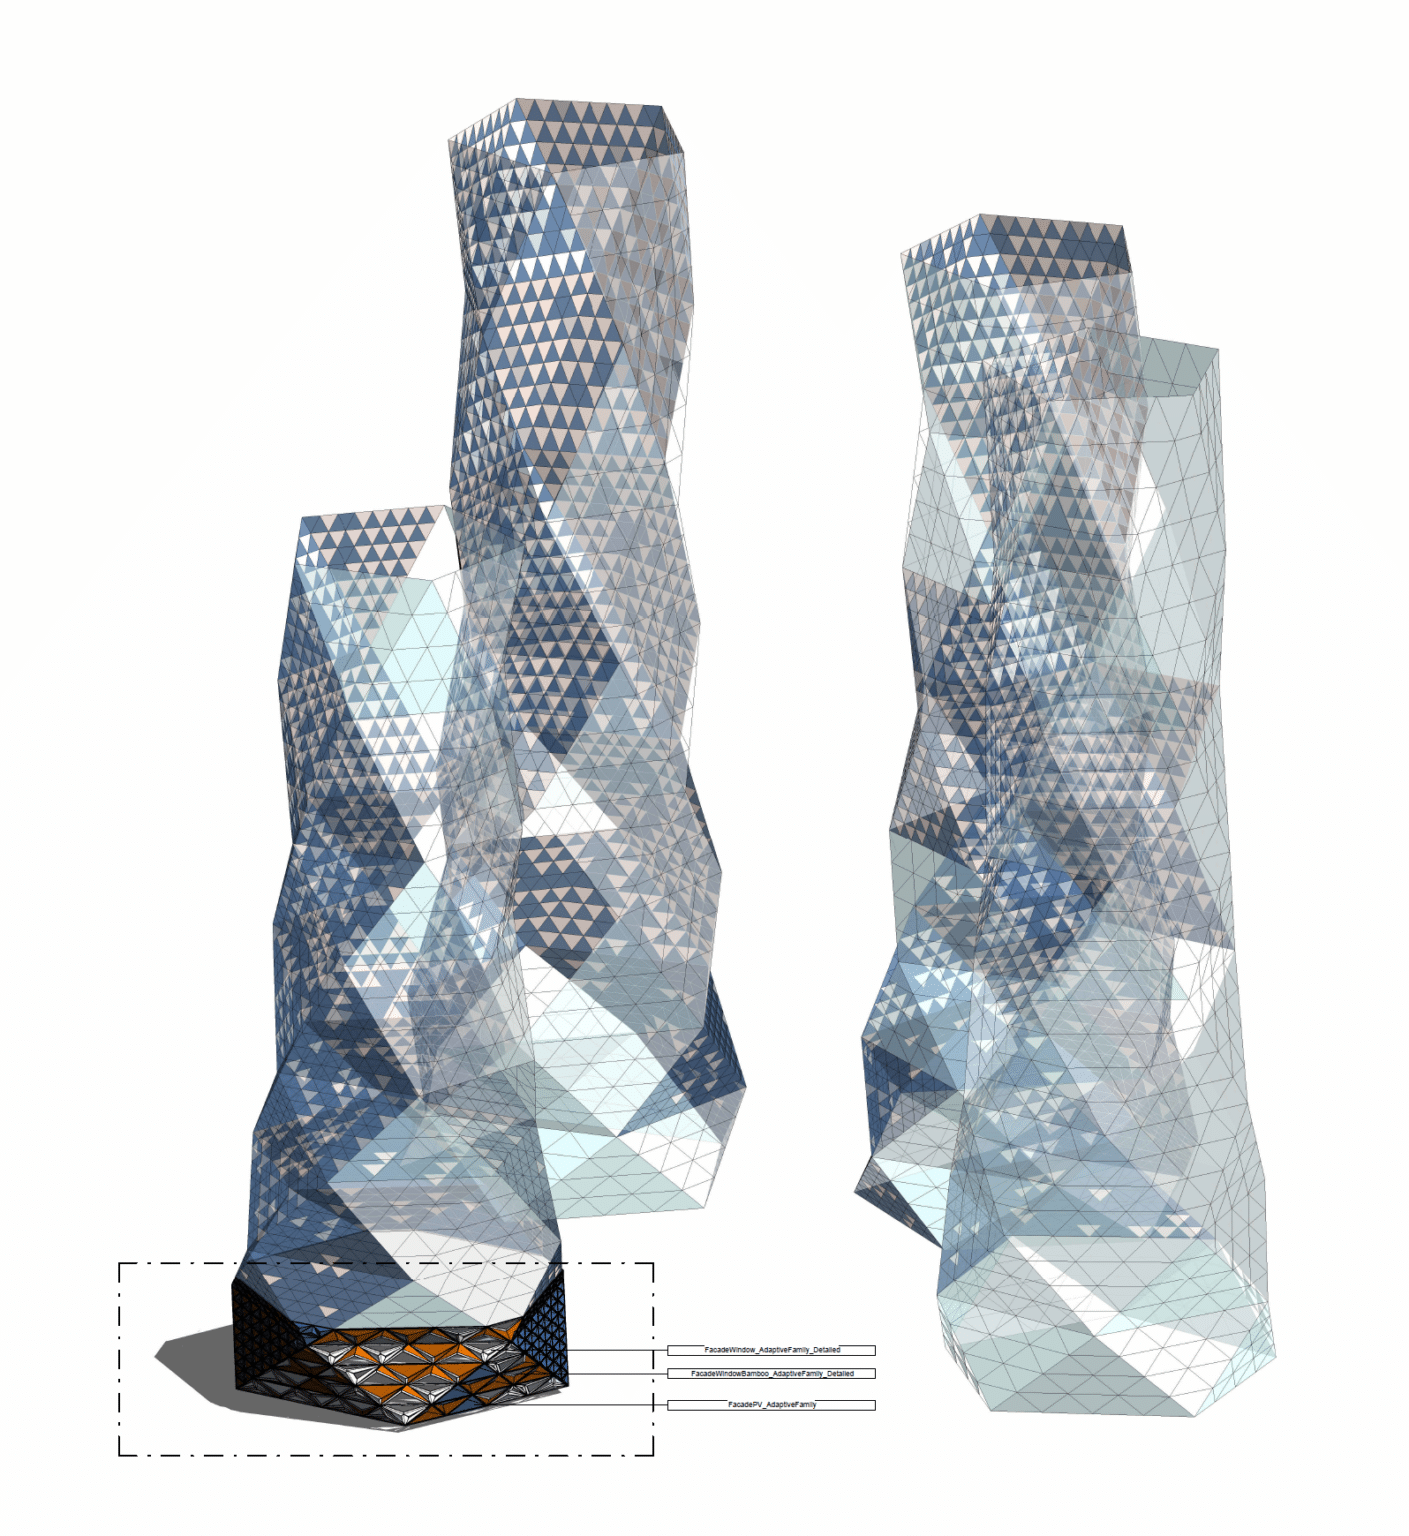
Analysis and Panel Subdivision
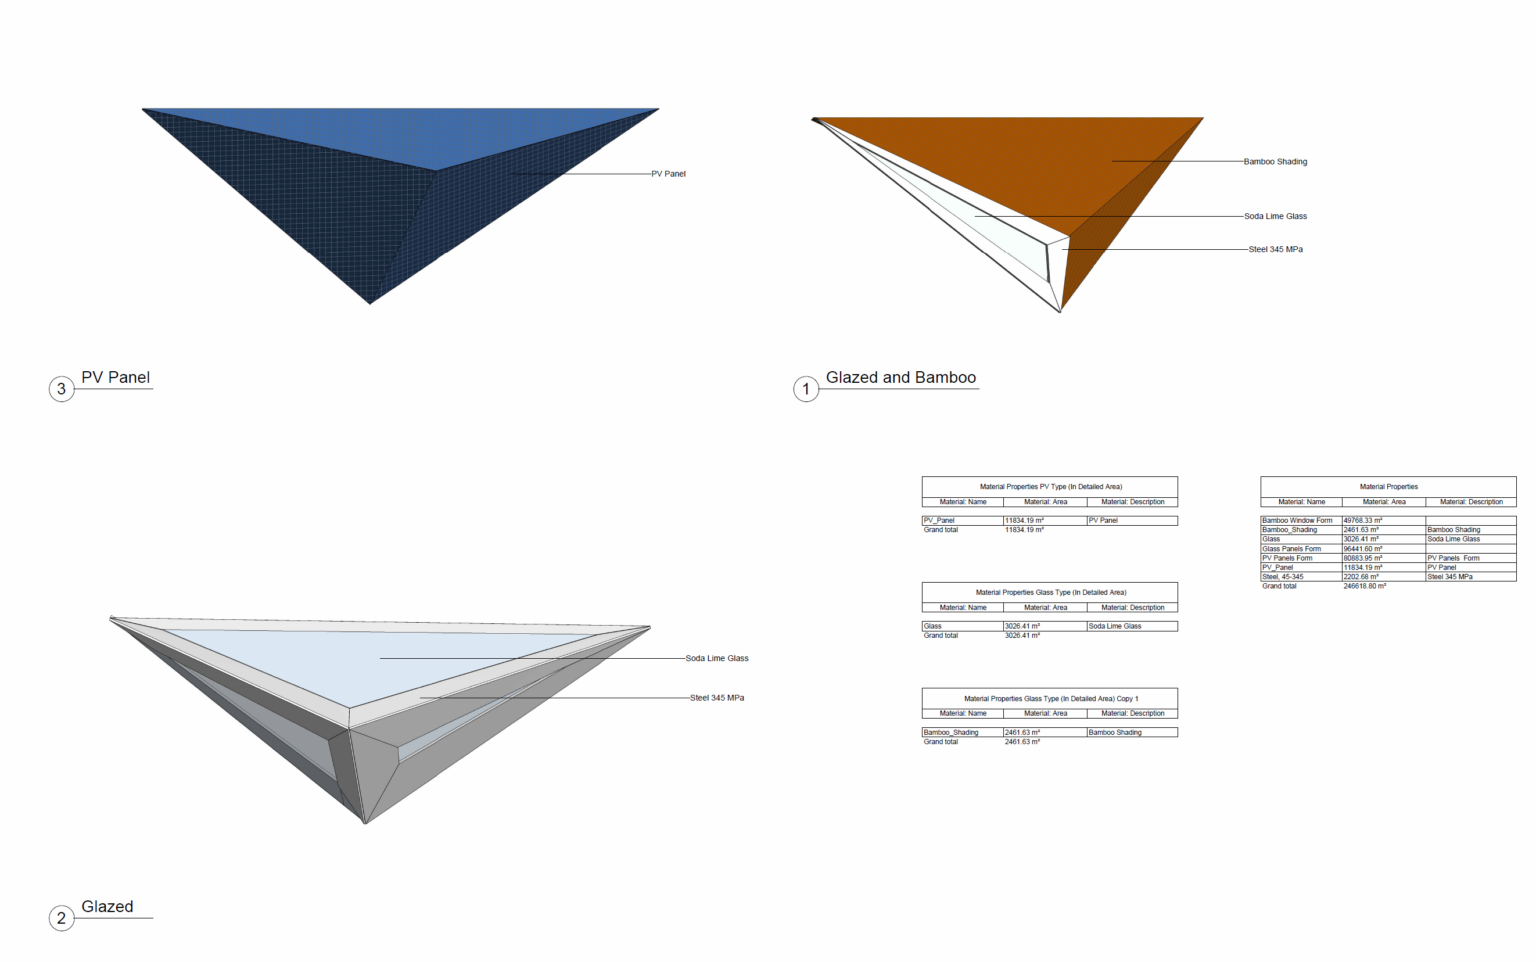
For our facade strategy, we subdivided the facade into three panel types based on environmental and functional requirements. We analyzed the building’s environmental factors to determine the optimal placement of each panel type, considering:
Thermal comfort to provide shading with a combination of glazed and bamboo panels..
Radiation potential for maximizing energy output with PV panels.
Program requirements to enhance views using fully glazed panels.
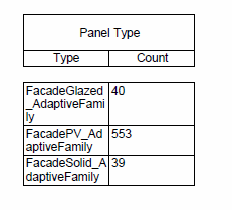
Creating the Adaptive Panel Families
We then created three adaptive families in Revit, maintaining the same point order as our script. This allows the panels to adjust in size and form depending on their position on the model’s surface. We also assigned materials and their properties, enabling us to track the quantity and total usage for each panel type.
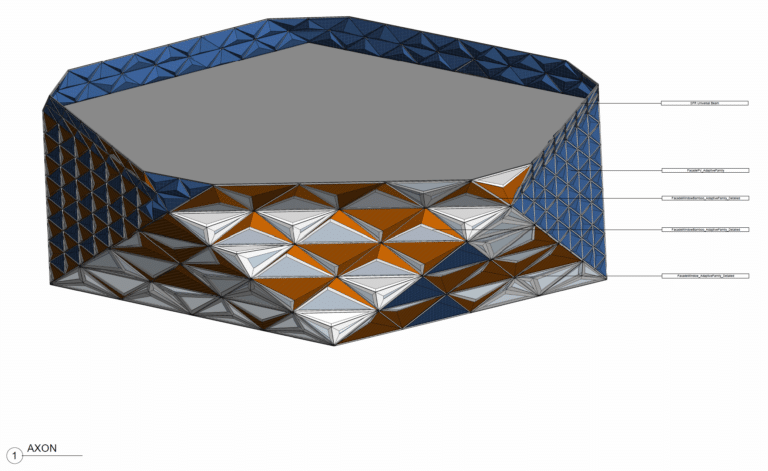
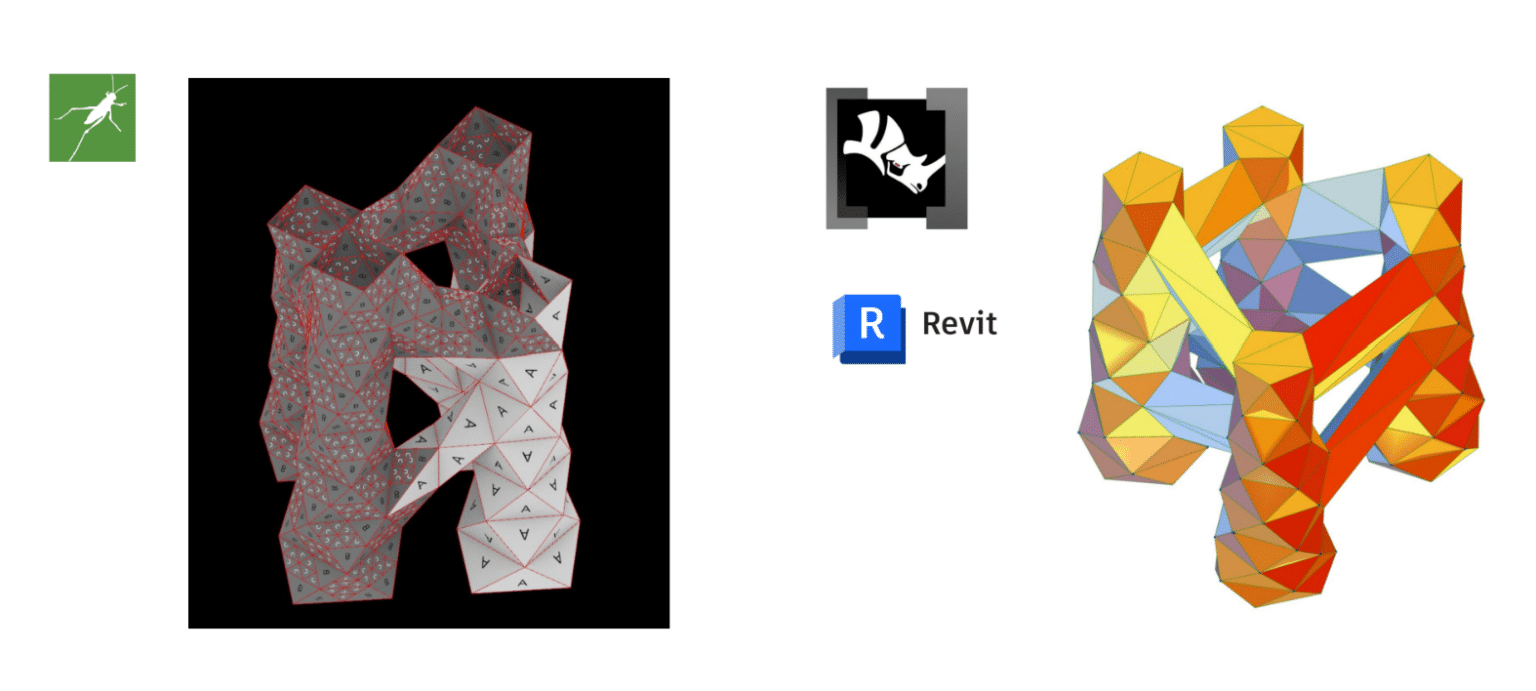
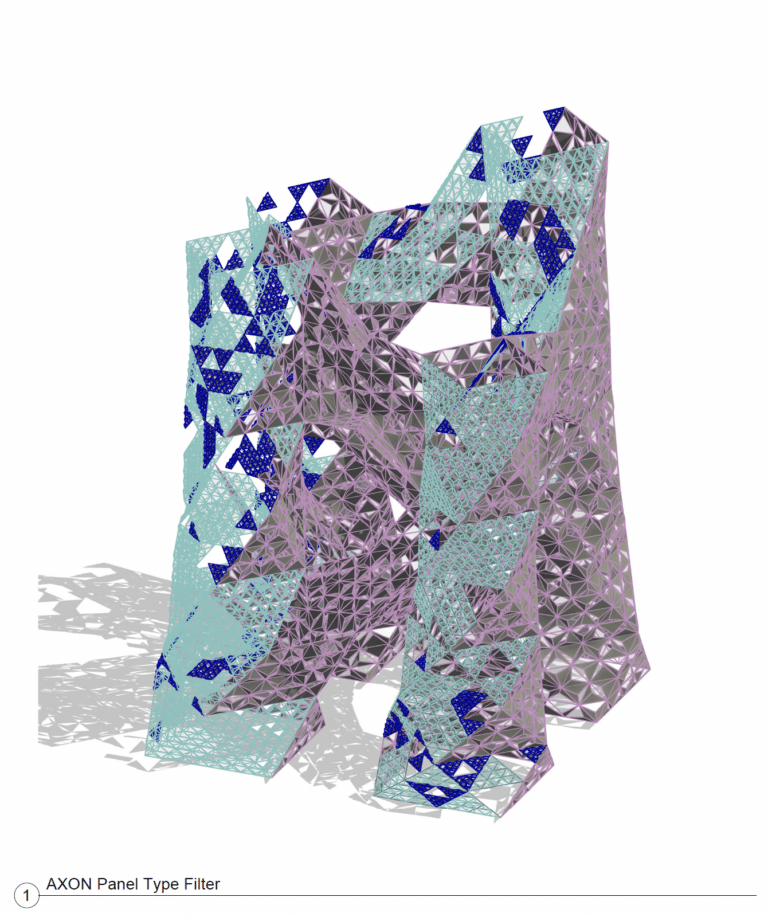
Applying the Panels
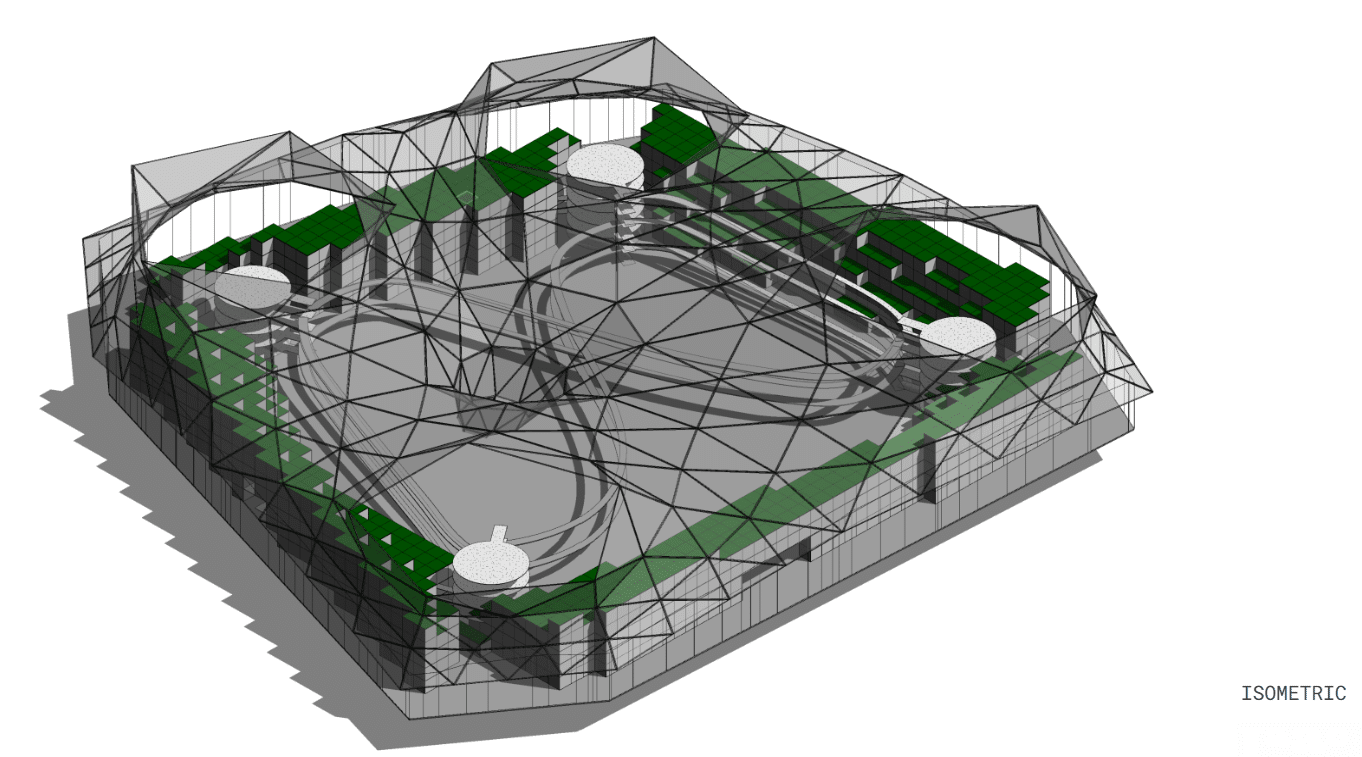
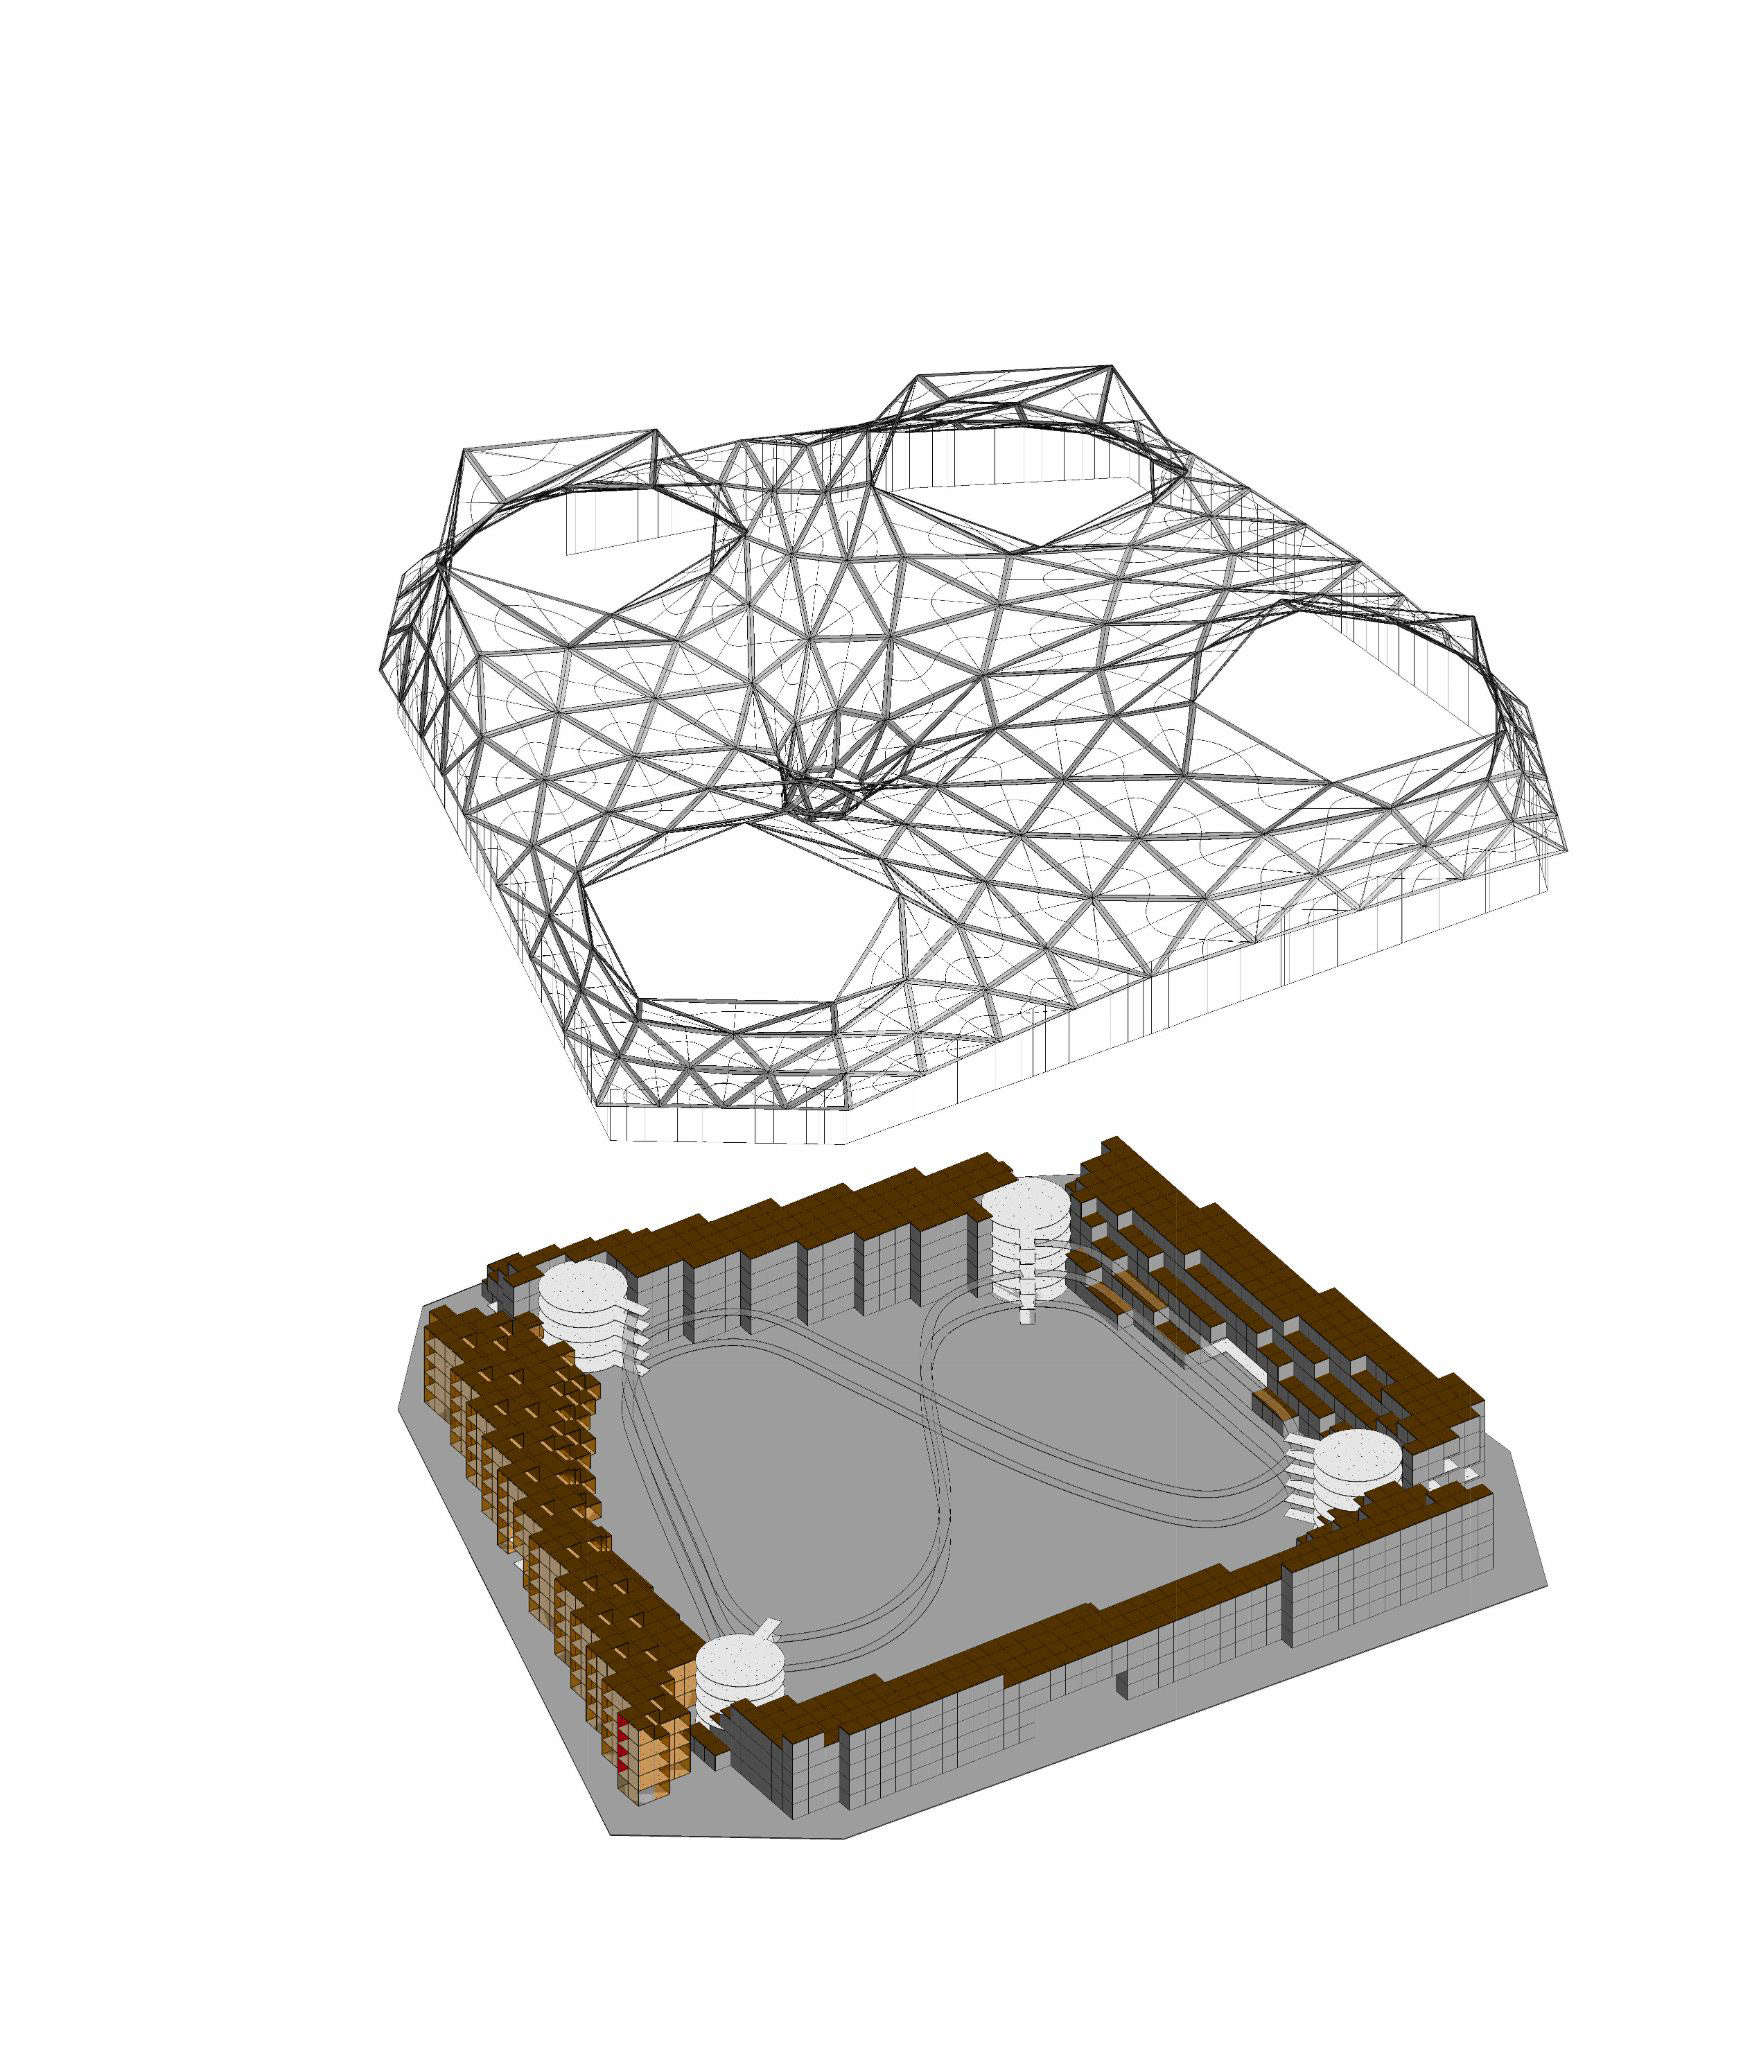
We applied the panels using Grasshopper. This axonometric illustrates how the panels are structurally integrated:
The structural framing is attached to the floor slabs.
The panels are mounted onto the structural framing.
This approach ensures that the panels align properly with the building’s load-bearing system while maintaining a consistent architectural language.
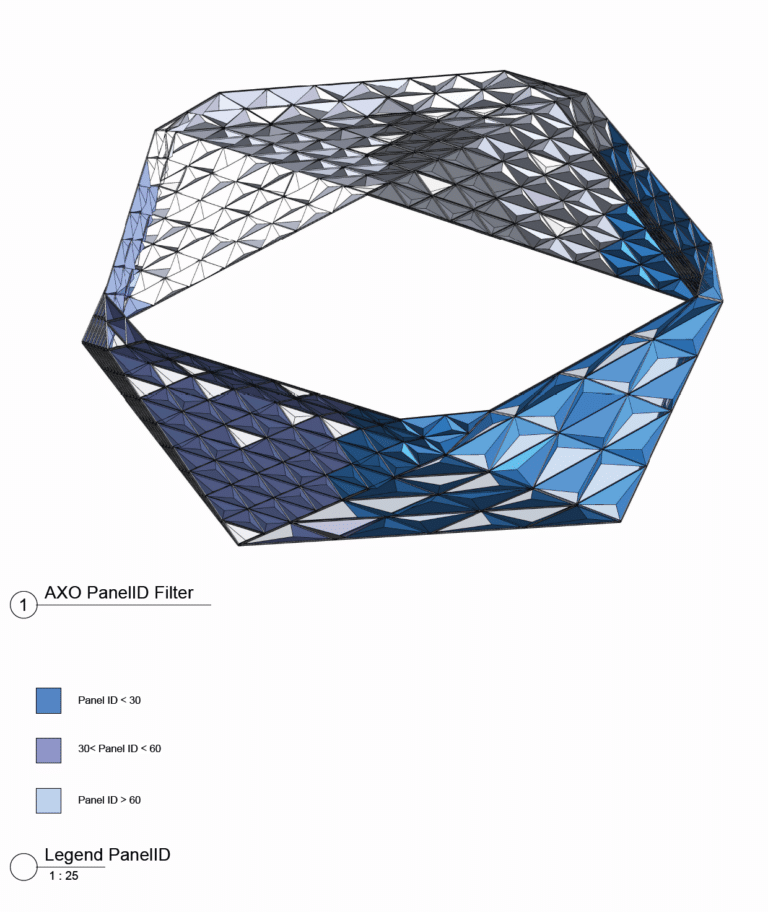
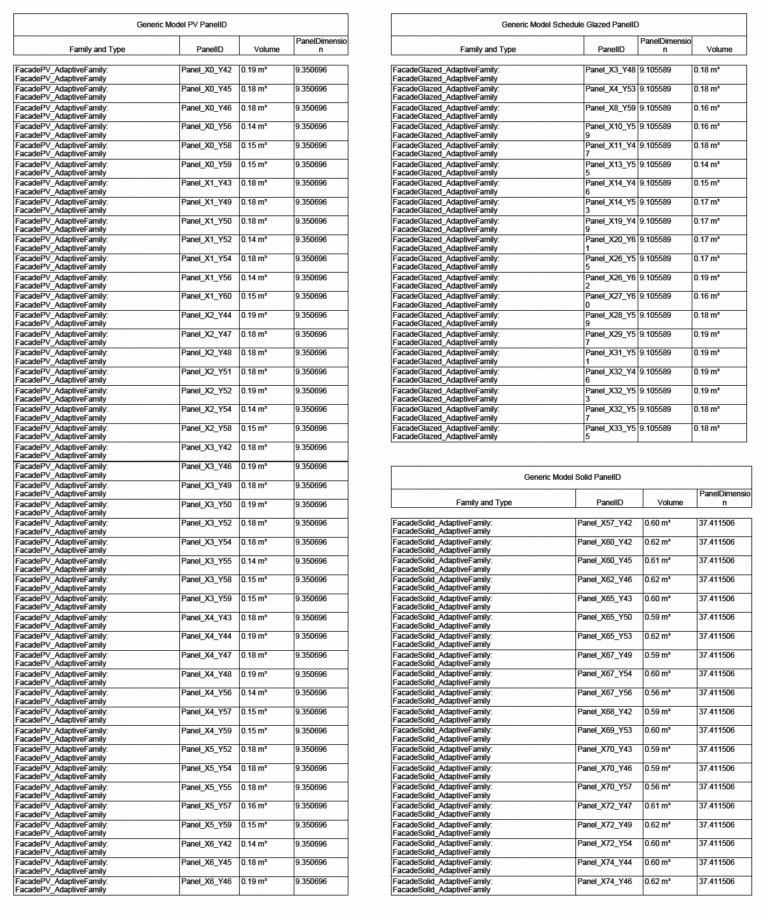
Applying the Data and Creating the Panels
To keep the facade organized, we developed a panel ID system based on the X and Y location of each panel. This allowed us to filter and track panels systematically, which helped streamline both the design and construction process.
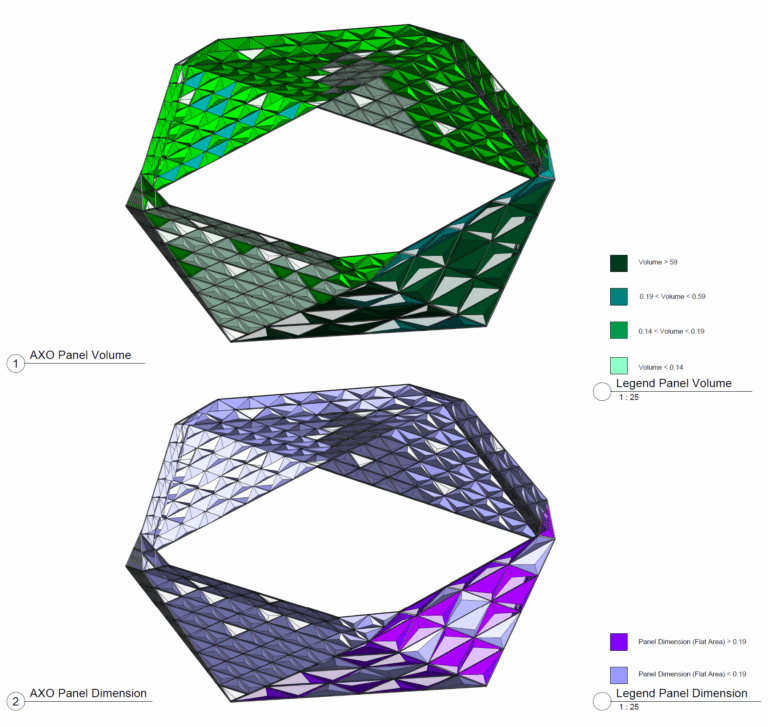
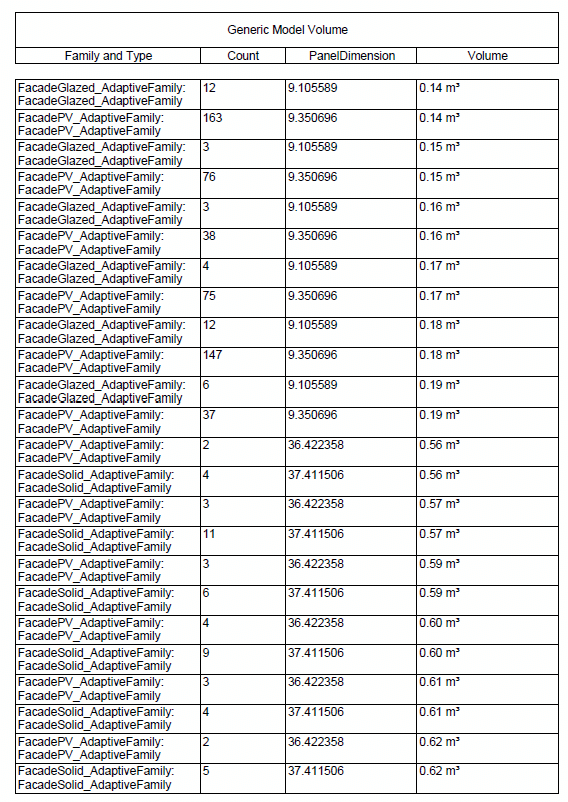
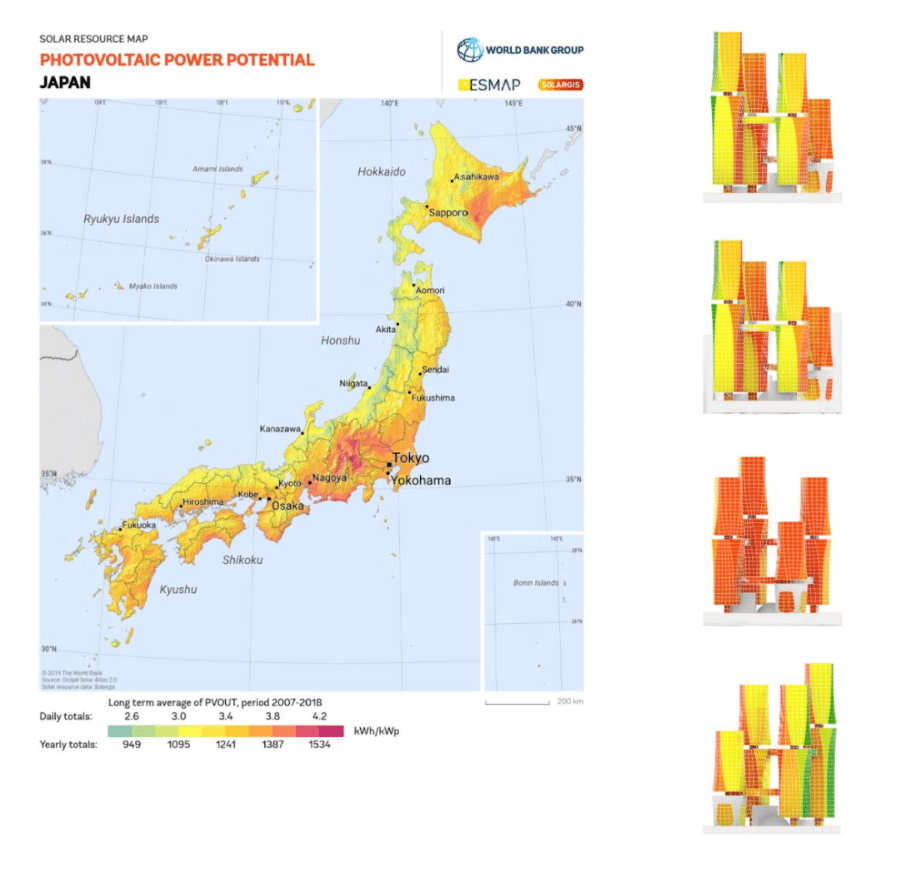
We calculated the area and volume of each panel type, which was essential for:
Accurately estimating material quantities.
Projecting the energy output of the PV panels based on their size and exposure.
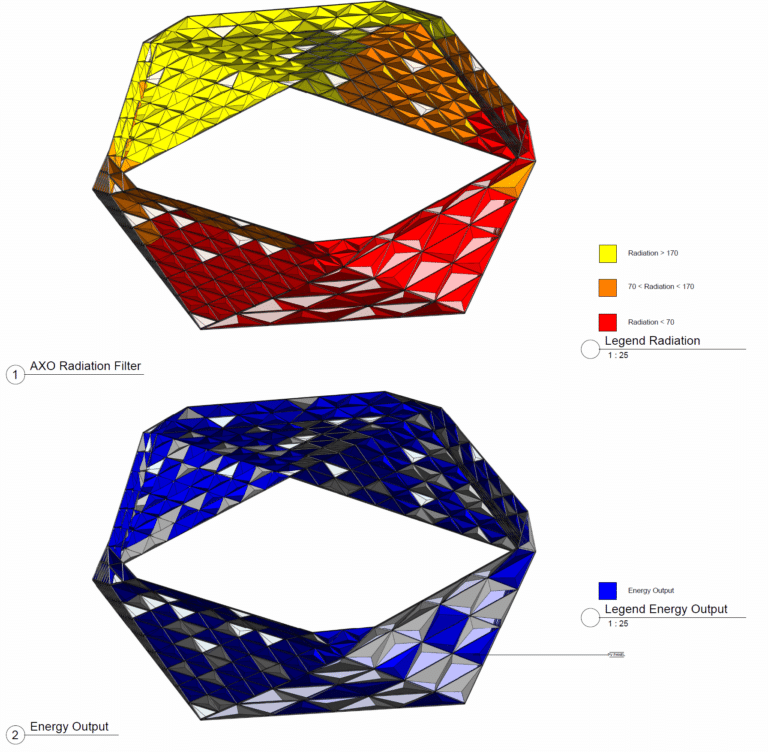
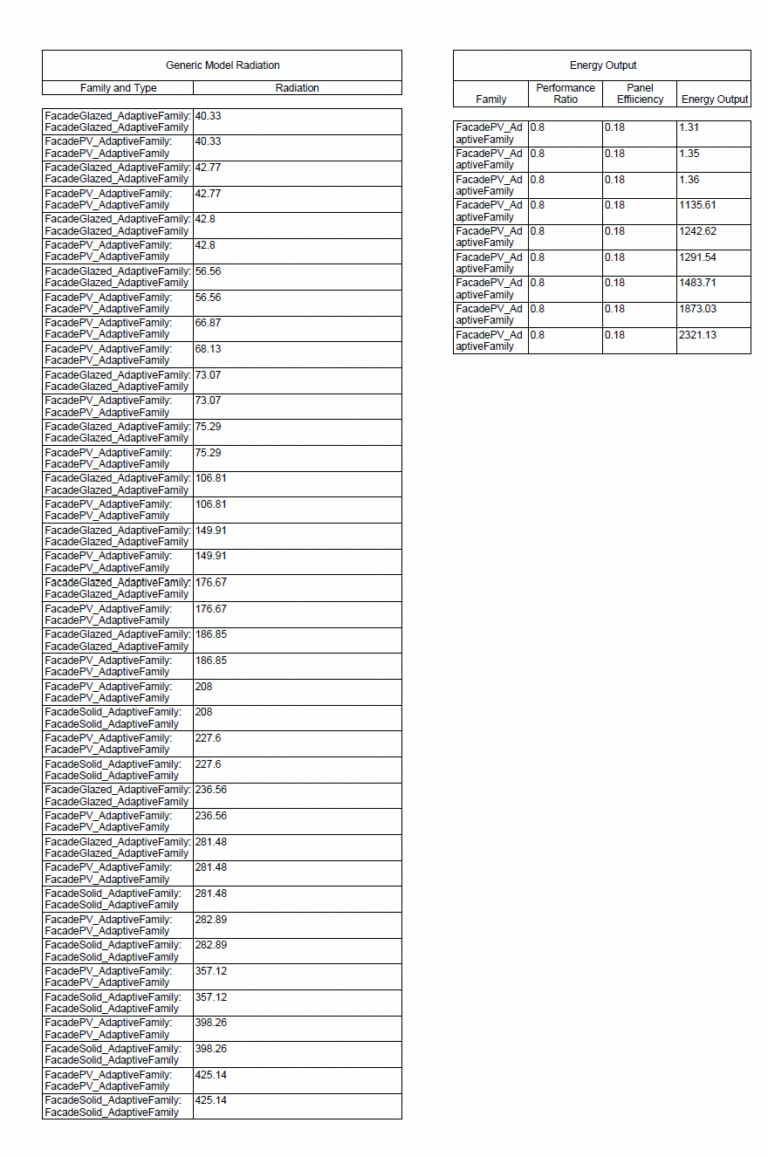
We mapped the energy potential of each panel based on:
Panel efficiency
Performance ratio
Exposed surface area
This allowed us to strategically position more PV panels in the highest-performing areas, optimizing the building’s overall energy output.
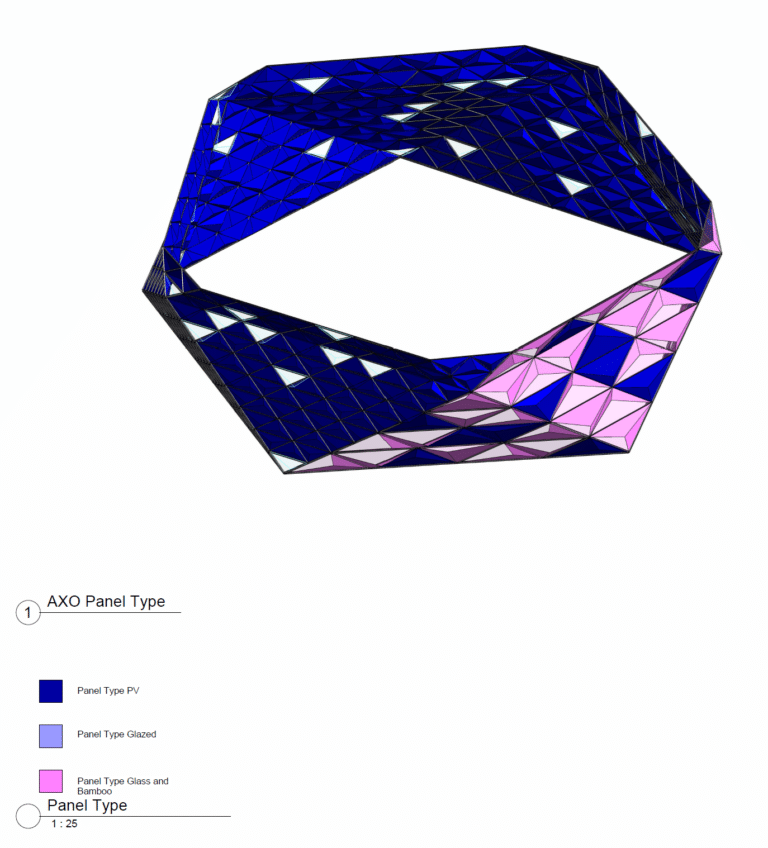
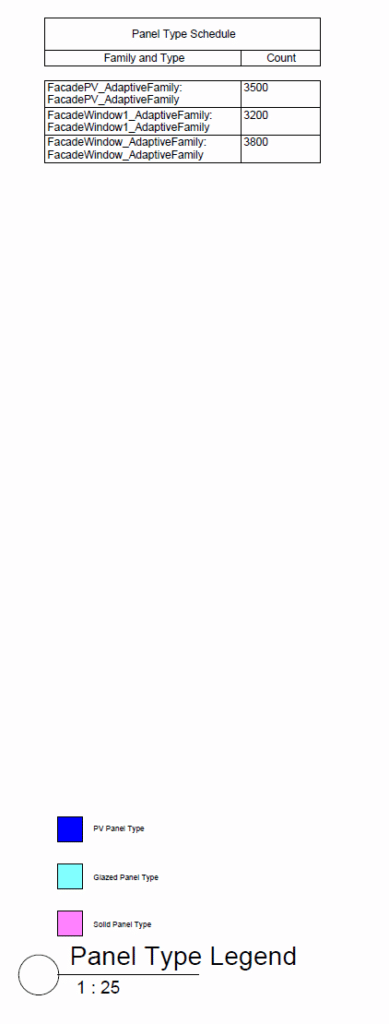
To simplify panel identification and management, we assigned specific colors to each panel type:
PV Panels
Full Glazed Panels
Bamboo Shading Panels
This made it easier to visualize the facade strategy and distribution across the building.
PODIUM
Measuring Success:
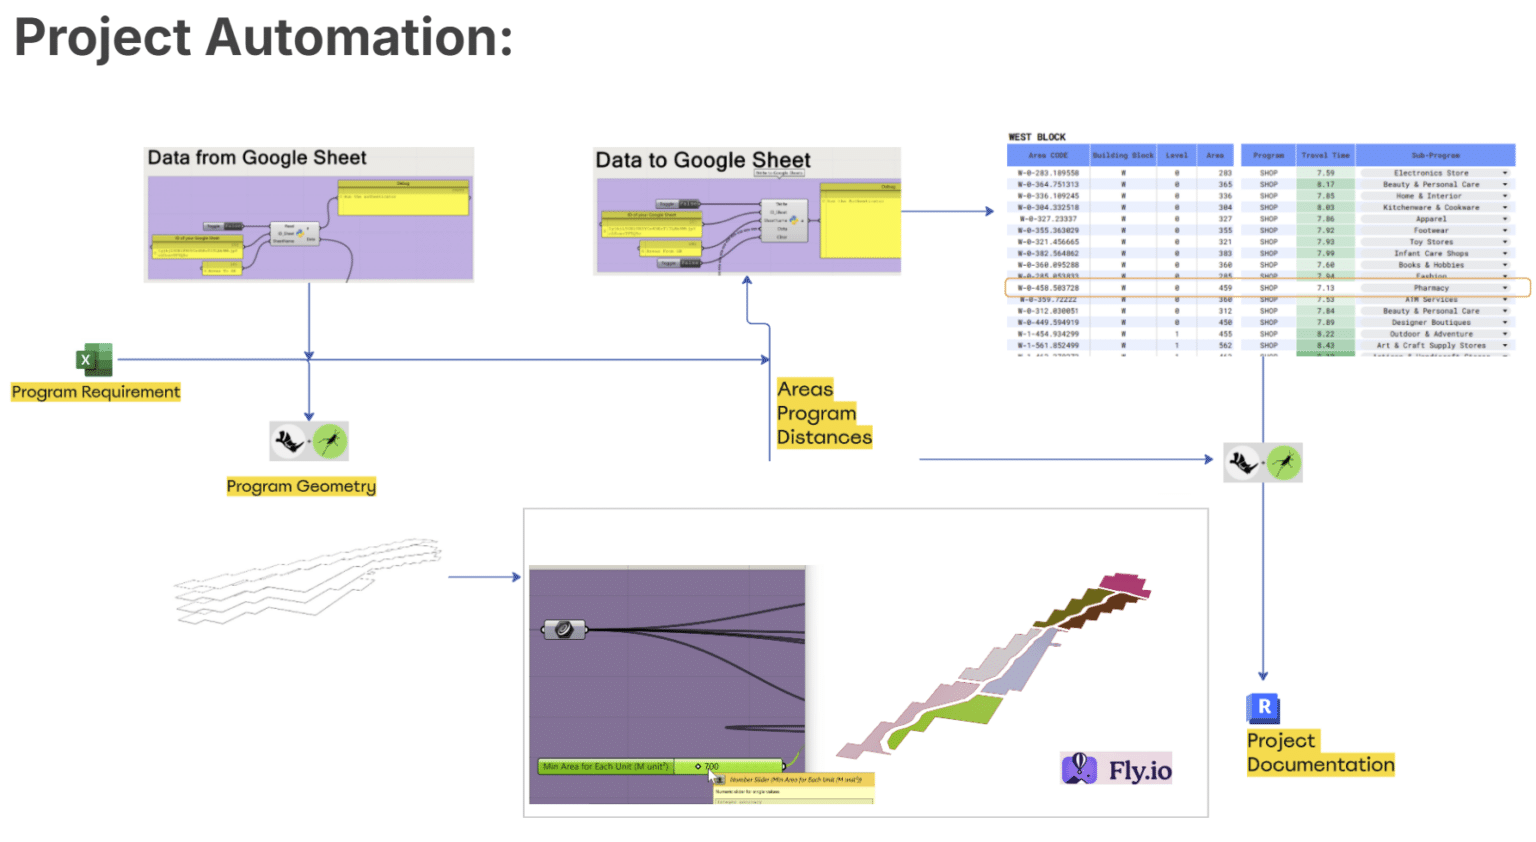
We created a Power BI dashboard with real-time visualization of programmatic distribution, featuring a Speckle model viewer for interactive spatial exploration and automated data analysis to evaluate travel distances, program allocations
Tools and Workflow
To execute this facade strategy, we used a combination of tools:
Grasshopper – To subdivide the facade.
Revit – To capture panel points and create adaptive panels.
Custom Parameters – Added for energy performance and material properties.
Grasshopper with Rhino.Inside.Revit – To allocate and place panels.
Speckle – To manage building massing and data exchange.